Case study 01 / Full Stack · Business Intelligence
A clearer picture of the business.
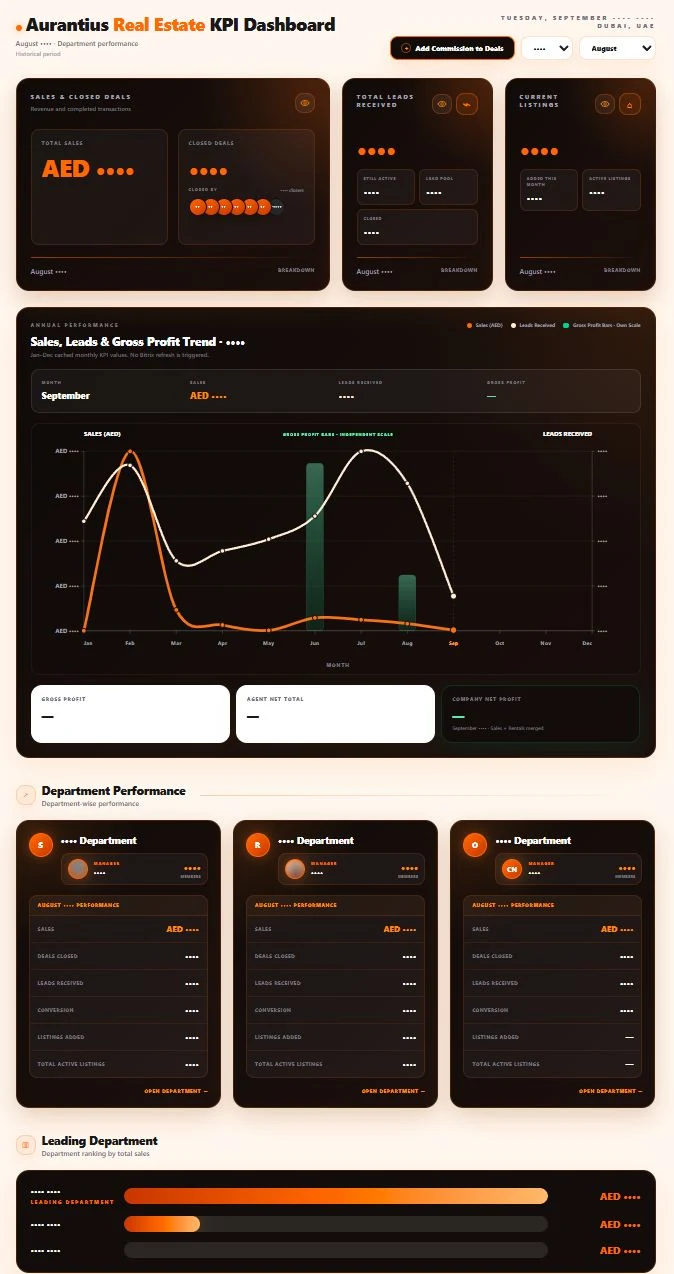
An operational CRM becomes a decision-making tool. Sales, commissions and agent performance, connected in one platform.
Bitrix24 BI Platform
End-to-end product development, CRM integration and business logic
01 / The challenge
Start with the problem.
Management depended on an administrator to enter KPI data into a standalone dashboard. Every update required manual work before the business could see its performance.
02 / The approach
Connect the moving parts.
- 01
Connected the platform directly to operational Bitrix24 data.
- 02
Built reporting across sales, leads, listings, departments and individual agents.
- 03
Implemented commission allocation, gross profit, agent net, company net and performance grading.
03 / Engineering decisions
The thinking behind the work.
Business rules before charts
Modelled attribution and commission rules so the numbers reflect how the business operates.
Access with context
Added role-based access for the people using the platform.
A view over time
Used historical caching to support KPI trends alongside operational reporting.
04 / The outcome
What changed.
Evolved a manually maintained dashboard into an API-driven business intelligence platform that supports day-to-day management decisions.
Shared on LinkedIn